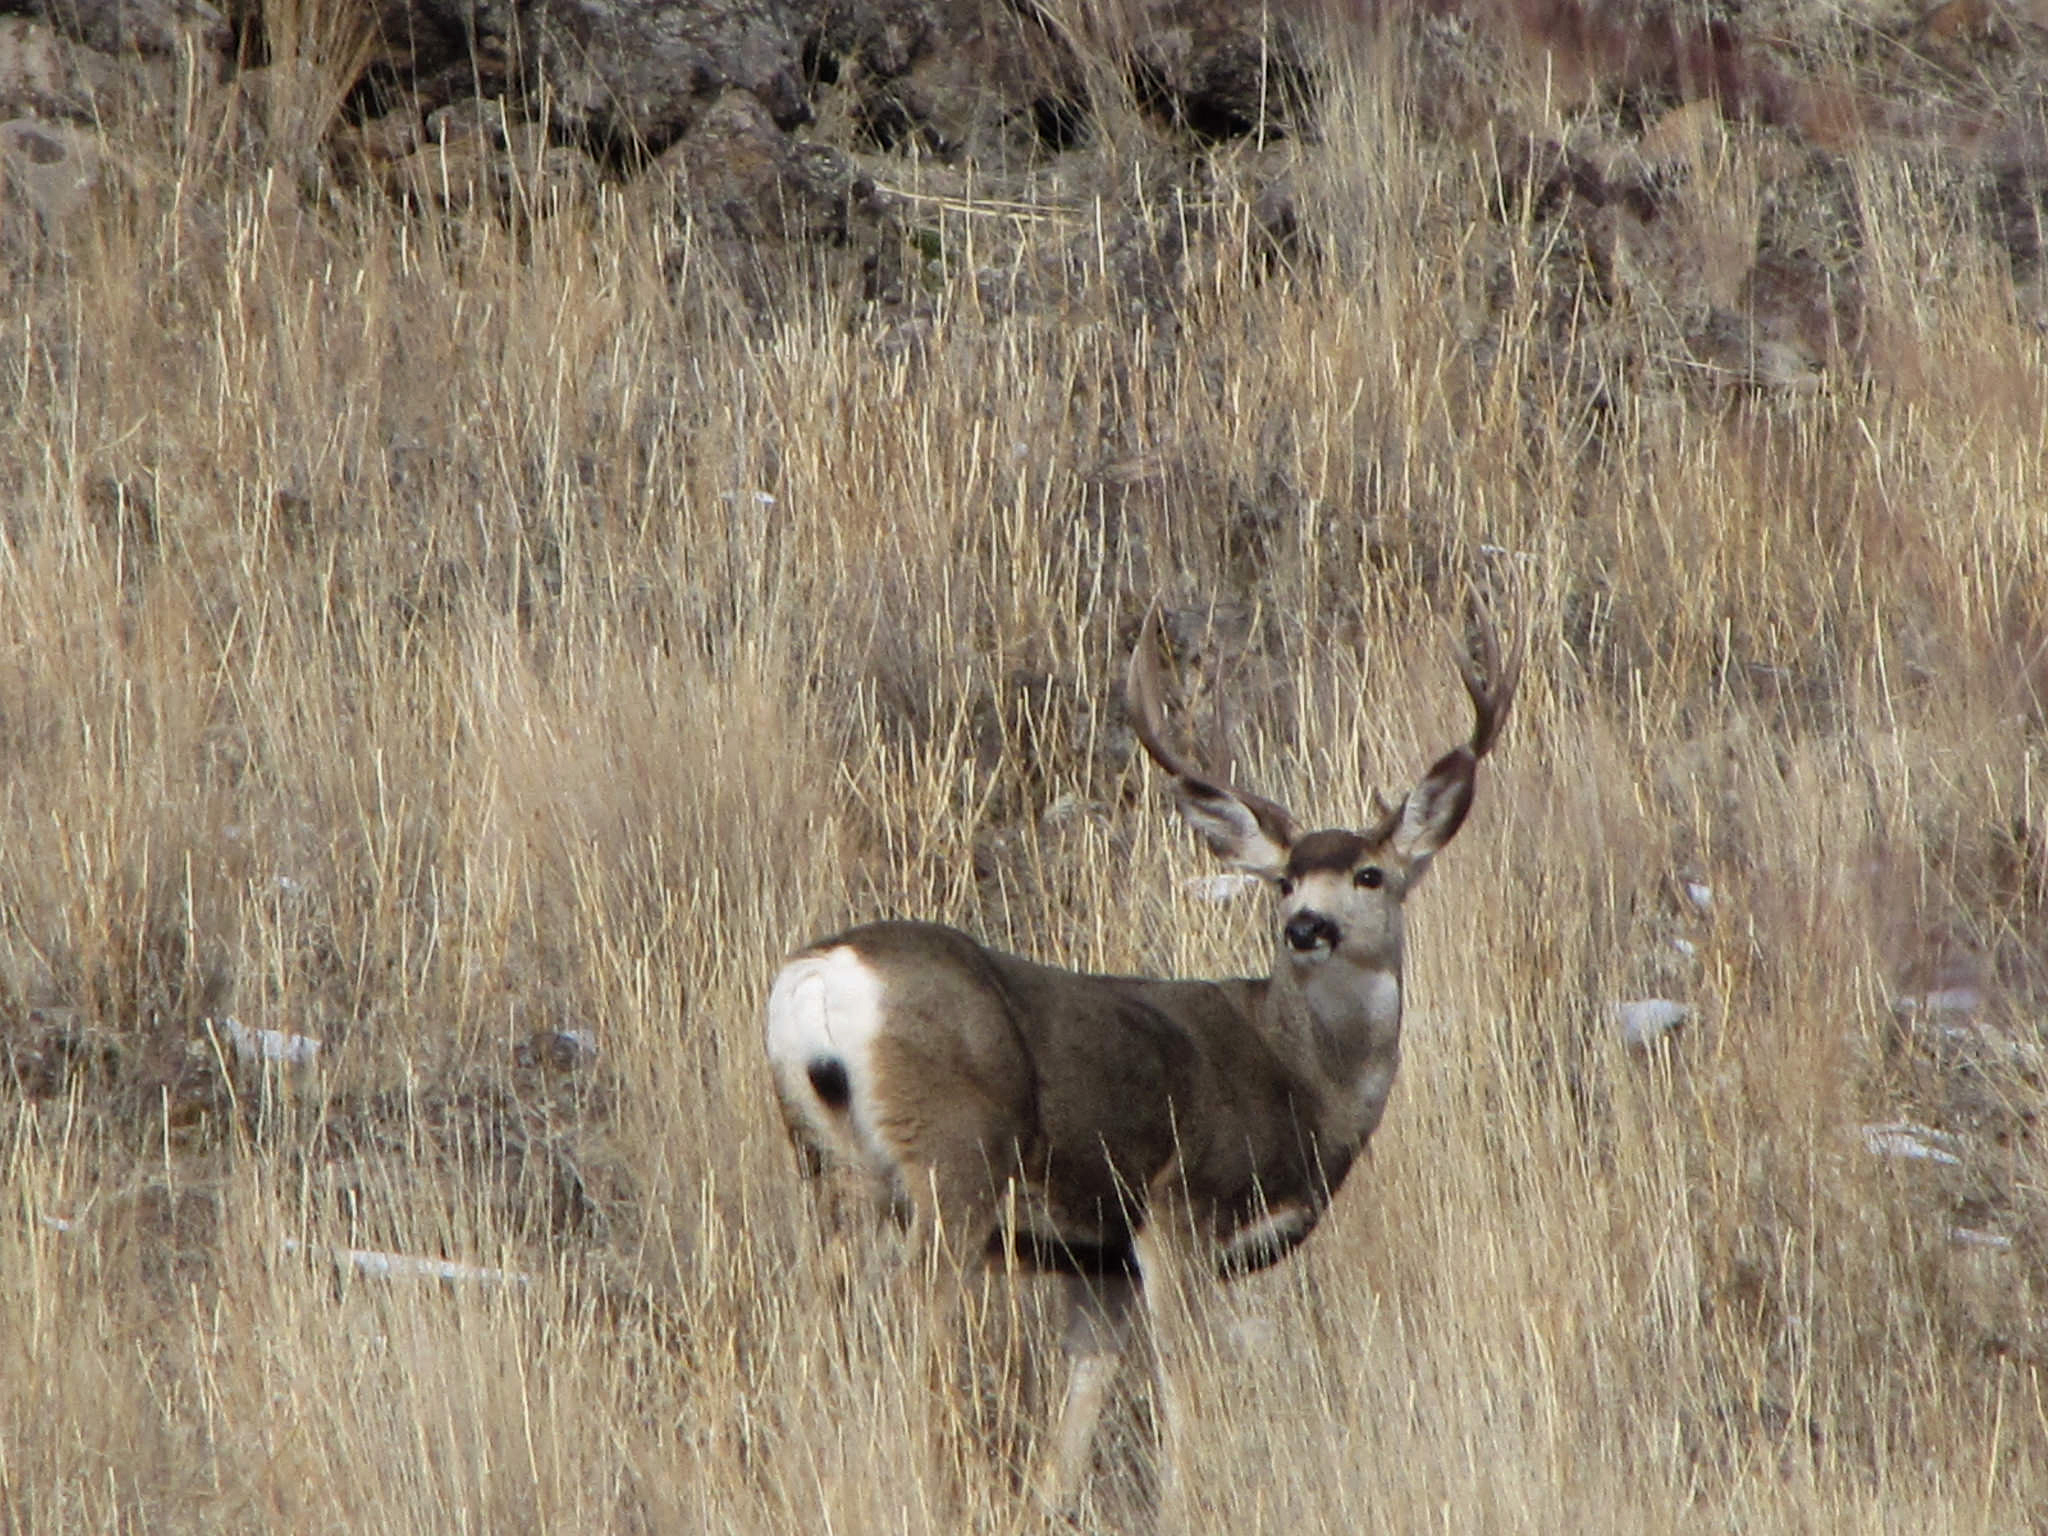
Idaho’s fall hunting season is likely to be outstanding. Coming on the heels of an all-time record white-tailed deer harvest in 2015 and the highest harvests in more than a decade for mule deer and elk, hunting this fall should be similar last year.
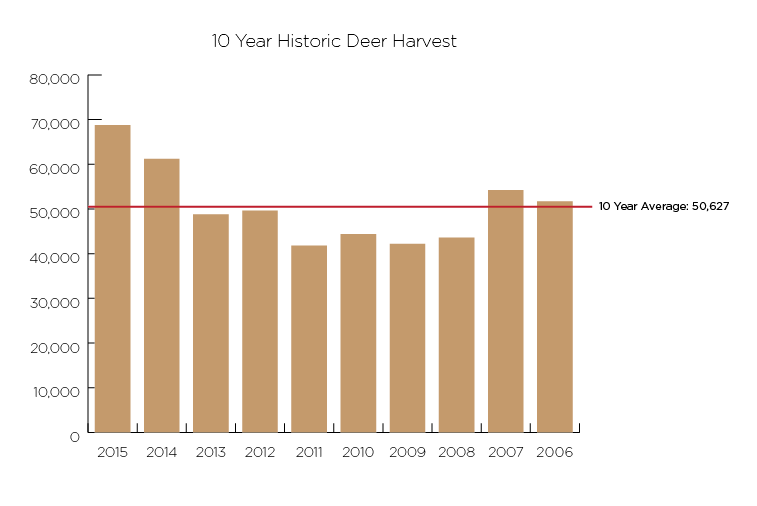
Let’s take a quick look at the 2015 hunt. Deer hunters had a 43-percent success rate in general season hunts and a 61 percent success rate in controlled hunts. They took 68,768 deer, which included a record 30,568 whitetails that topped the previous record of 29,800 whitetails set in 1999. It was also the largest deer harvest since 1991, and 36 percent above the 10-year average harvest.
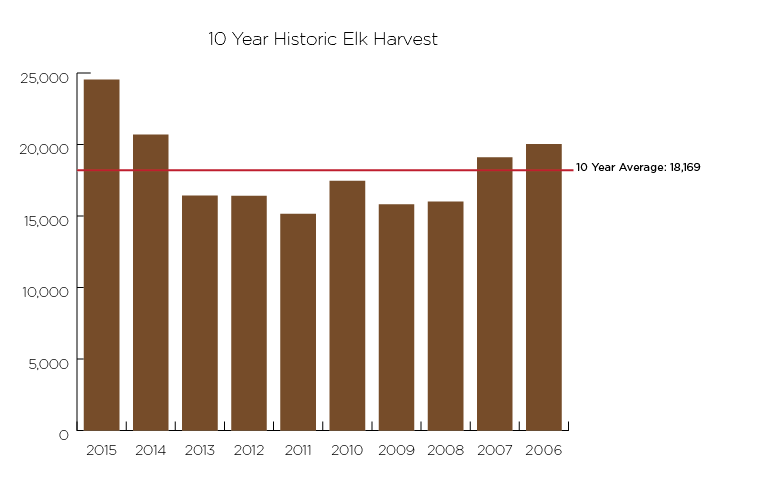
Elk hunters weren’t far behind. They harvested 24,543 elk in 2015, which easily topped the 2014 harvest of 20,700 which was considered a pretty good year. It was also 35 percent above the 10-year average, and the largest elk harvest since 1996. General-season elk hunters had a 22 percent success rate, and hunters with controlled tags more than doubled that with 46 percent success. Combined, the average success rate was 27 percent for elk hunting.
With a little luck, elk hunters this year could top 25,000 elk during fall hunts,which has only happened three times in the last 40 years.
And that new whitetail record may be short-lived. The 2016 harvest could “easily match” last year’s, according to Fish and Game’s big game manager Jon Rachael. With whitetail hunting growing in popularity in Idaho and whitetail populations strong, this year could break another record.
Mule deer hunters won’t get left out of the bounty. Herds are healthy and growing throughout much of the state and should provide an above-average harvest. With a little help from the weather in fall, it could also be an exceptional year for mule deer hunting.
Winter survival
A variety of factors affect the big game harvest. Winter survival – particularly fawns and calves – is an indicator of the upcoming hunting season, as well as summer forage, fall weather that affects hunting conditions and predation.
A harsh winter can severely impact big game herds. Deer are most vulnerable, especially fawns, and last year’s fawns become this year’s young bucks that make up a large portion of the fall harvest.
In most parts of the state, Idaho had a normal winter, but snow came earlier than in recent years, and there was a cold snap in late December and early January that brought sub-zero temperatures to parts of the state. That likely to contributed to lower winter survival than the previous two winters, which were unusually mild.
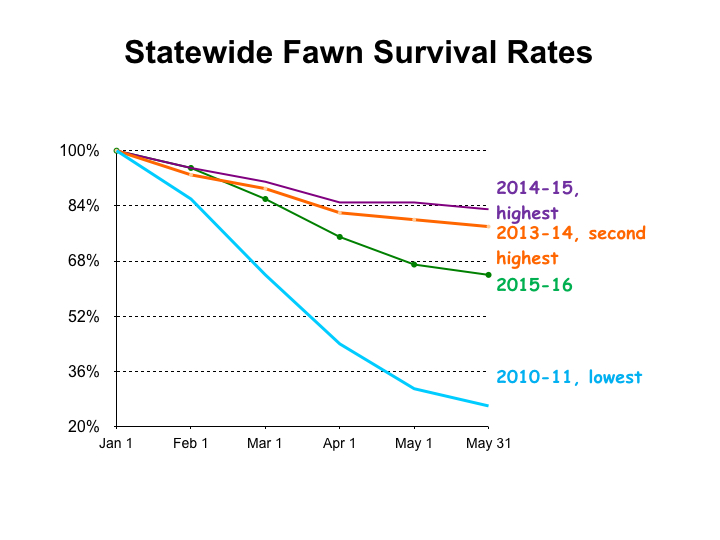
Fish and Game captures and puts radio collars on mule deer fawns each winter, then tracks how many survive through mid spring. Statewide survival of radio-collared fawns was 64 percent, which is down from a record-high 83-percent survival in the 2014-15 winter, and 78 percent the prior winter.
However, last winter’s fawn survival still tracked above the 10-year average of 58 percent.
In addition to fawns, F&G also radio collared 472 adult does, tracked them throughout winter and early spring, and 93 percent of them survived, compared with 95 percent the previous two winters.
More harvest, more hunters, great opportunity
Deer and elk harvests were both higher in 2015, and there were also more hunters. Deer tag sales jumped by 5,978 tags between 2014 and 2015, and elk tag sales increased by 4,297. However, success rates for deer and elk hunters both improved in 2015 over the previous year.
Idaho hunters get lots of general-season hunts, a rarity in Western hunting these days, so hunters can buy a license and deer and elk tag and go. Not only that, general season hunters do very well. They took 83 percent of the deer and 59 percent of the elk harvested in 2015.
That’s not to say hunters who drew coveted controlled-hunt tags were not successful. Elk hunters who participated in controlled hunts were more than twice as likely to harvest as those with general-hunt tags (46 percent vs. 22 percent), and 61 percent of deer hunters with controlled-hunt tags harvested a deer vs. 43 percent for general seasons.
Deer
Deer harvests have made a significant jump in the last two years, thanks in part to consecutive mild winters that resulted in more deer available for the 2015 and 2014 hunting seasons, and more hunters. Deer tag sales also jumped by 5,978 tags between 2014 and 2015, which shows interest in deer hunting corresponded.
Fish and Game nearly sold out its nonresident deer-tag quota in 2015, which includes both nonresident and second tag sales (residents and nonresidents can buy unsold nonresident deer tags as second deer tags at the nonresident price).
With the bulk of big game tags being sold in the fall, it’s hard to tell how many will be sold this year, but midway through summer, tag sales were up compared with the same time last year.
Not only were deer harvests up, but there was a good proportion of mature bucks with 44 percent of the bucks harvested during general seasons being four-points or larger (Western count).
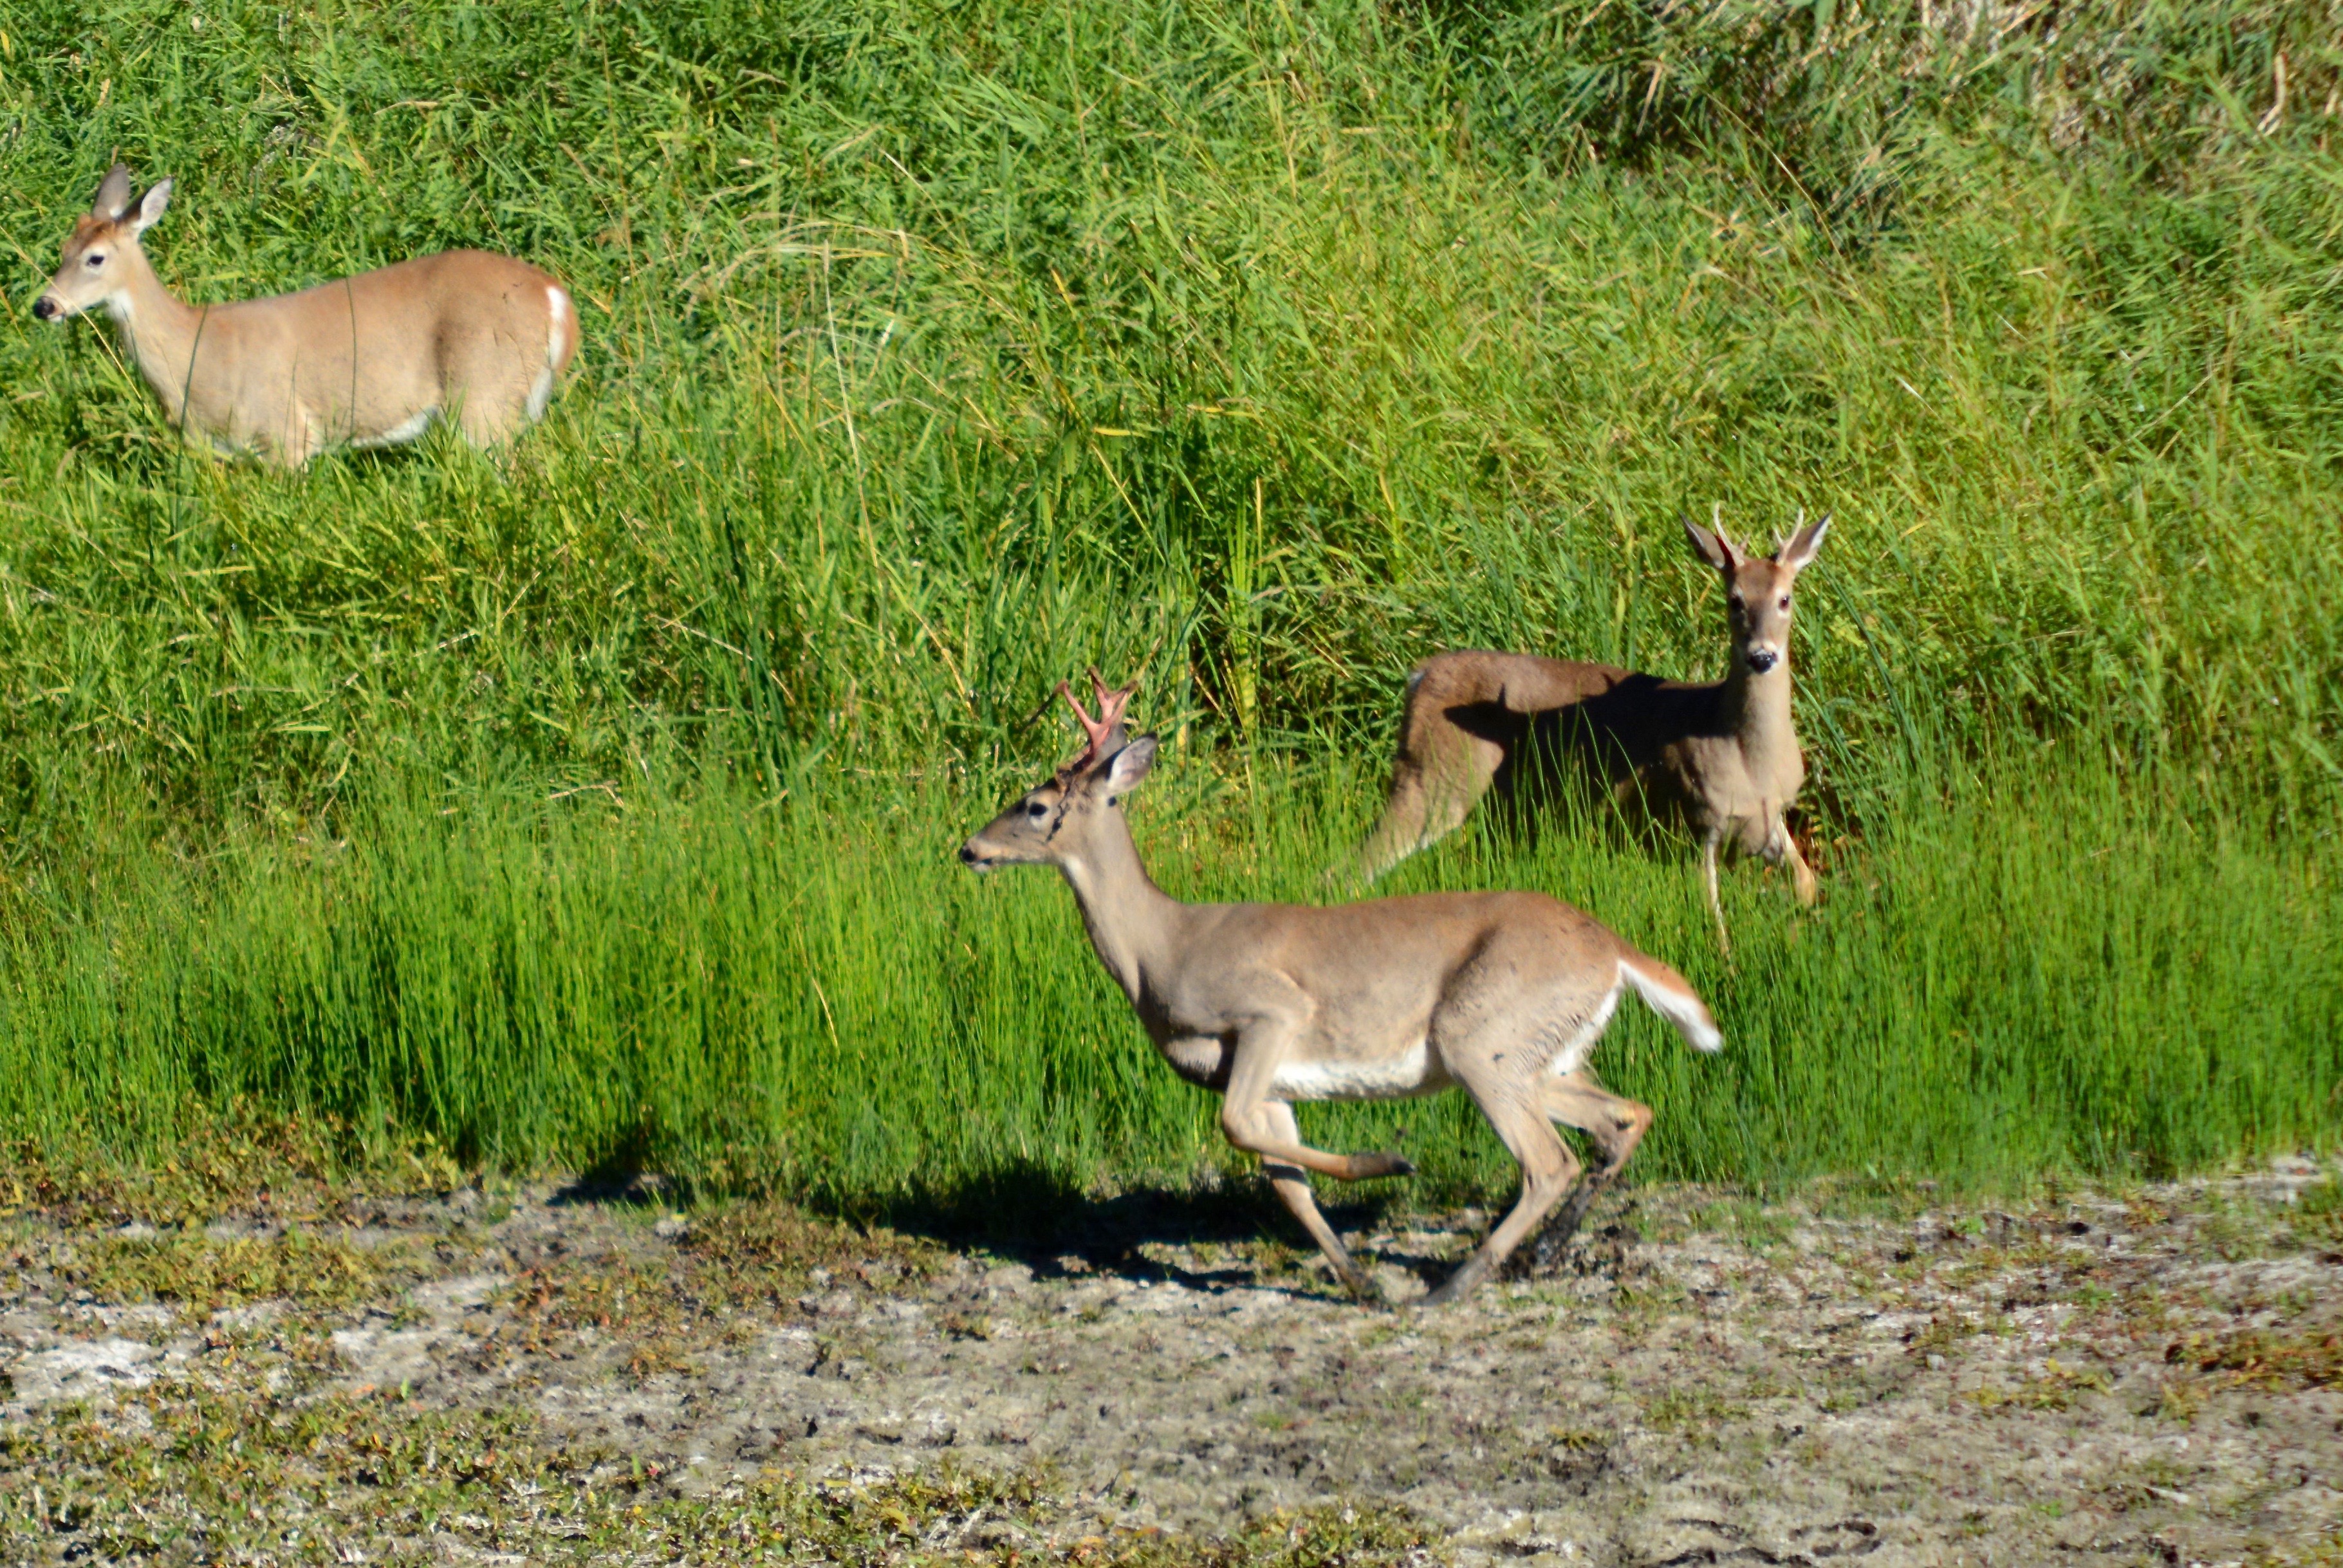
Idaho’s deer hunters have two good options this year. Abundant whitetail populations in the central and northern parts of the state provide lots of either-sex hunting, long hunting seasons, and an opportunity for a mature whitetail buck.
Despite a record harvest of whitetails in 2015, mule deer were still a higher proportion of the deer harvest (55 percent vs. 45 percent).
But whitetail hunters have higher success rates than mule deer hunters, thanks in part to long seasons for whitetail hunting that extend into the November rut and generous opportunities for either-sex hunting. The top 10 hunting units based on success rates were largely found in the Panhandle and Clearwater regions, which are predominantly whitetail country.
There’s also no reason why hunters couldn’t top last year’s record whitetail harvest because populations remain strong in those core areas.
“Everything looks good, and I wouldn’t be surprised,” said Dave Koehler, regional wildlife biologist for the Clearwater Region. “Our whitetail harvest has been on a steady, upward trajectory for a long time.”
He said a mild winter was followed by a cool, wet spring that has kept forage green into summer and provided excellent growing conditions for deer. He also noted with the growth of whitetail herds has attracted attention from more hunters and more hunting effort could mean a larger harvest this year.
Mule deer
Mule deer hunters in the southern and eastern parts of the state, and where the animals overlap with whitetails in northern and central Idaho, are also seeing healthy herds in most areas. Mule deer hunters will find a mix of general season hunting opportunity and controlled hunts that offer excellent success rates and chances for mature bucks.
Mule deer hunters should see hunting comparable to last year.
“I don’t see any indicators that mule deer harvests will decline,” Rachael said.
The wild card for mule deer hunters is usually fall weather since most the hunting seasons take place in October, especially general, any-weapon seasons that account for the most of the harvest.
Warm, dry October weather can make hunting challenging, which often reduces the harvest. Conversely, wet weather and early-season snow storms mean better hunting conditions, and storms can also drive deer out of the high country and into more accessible areas, which usually increases the harvest.
Elk
Despite a record whitetail season, improved elk hunting in Idaho may be the biggest news.
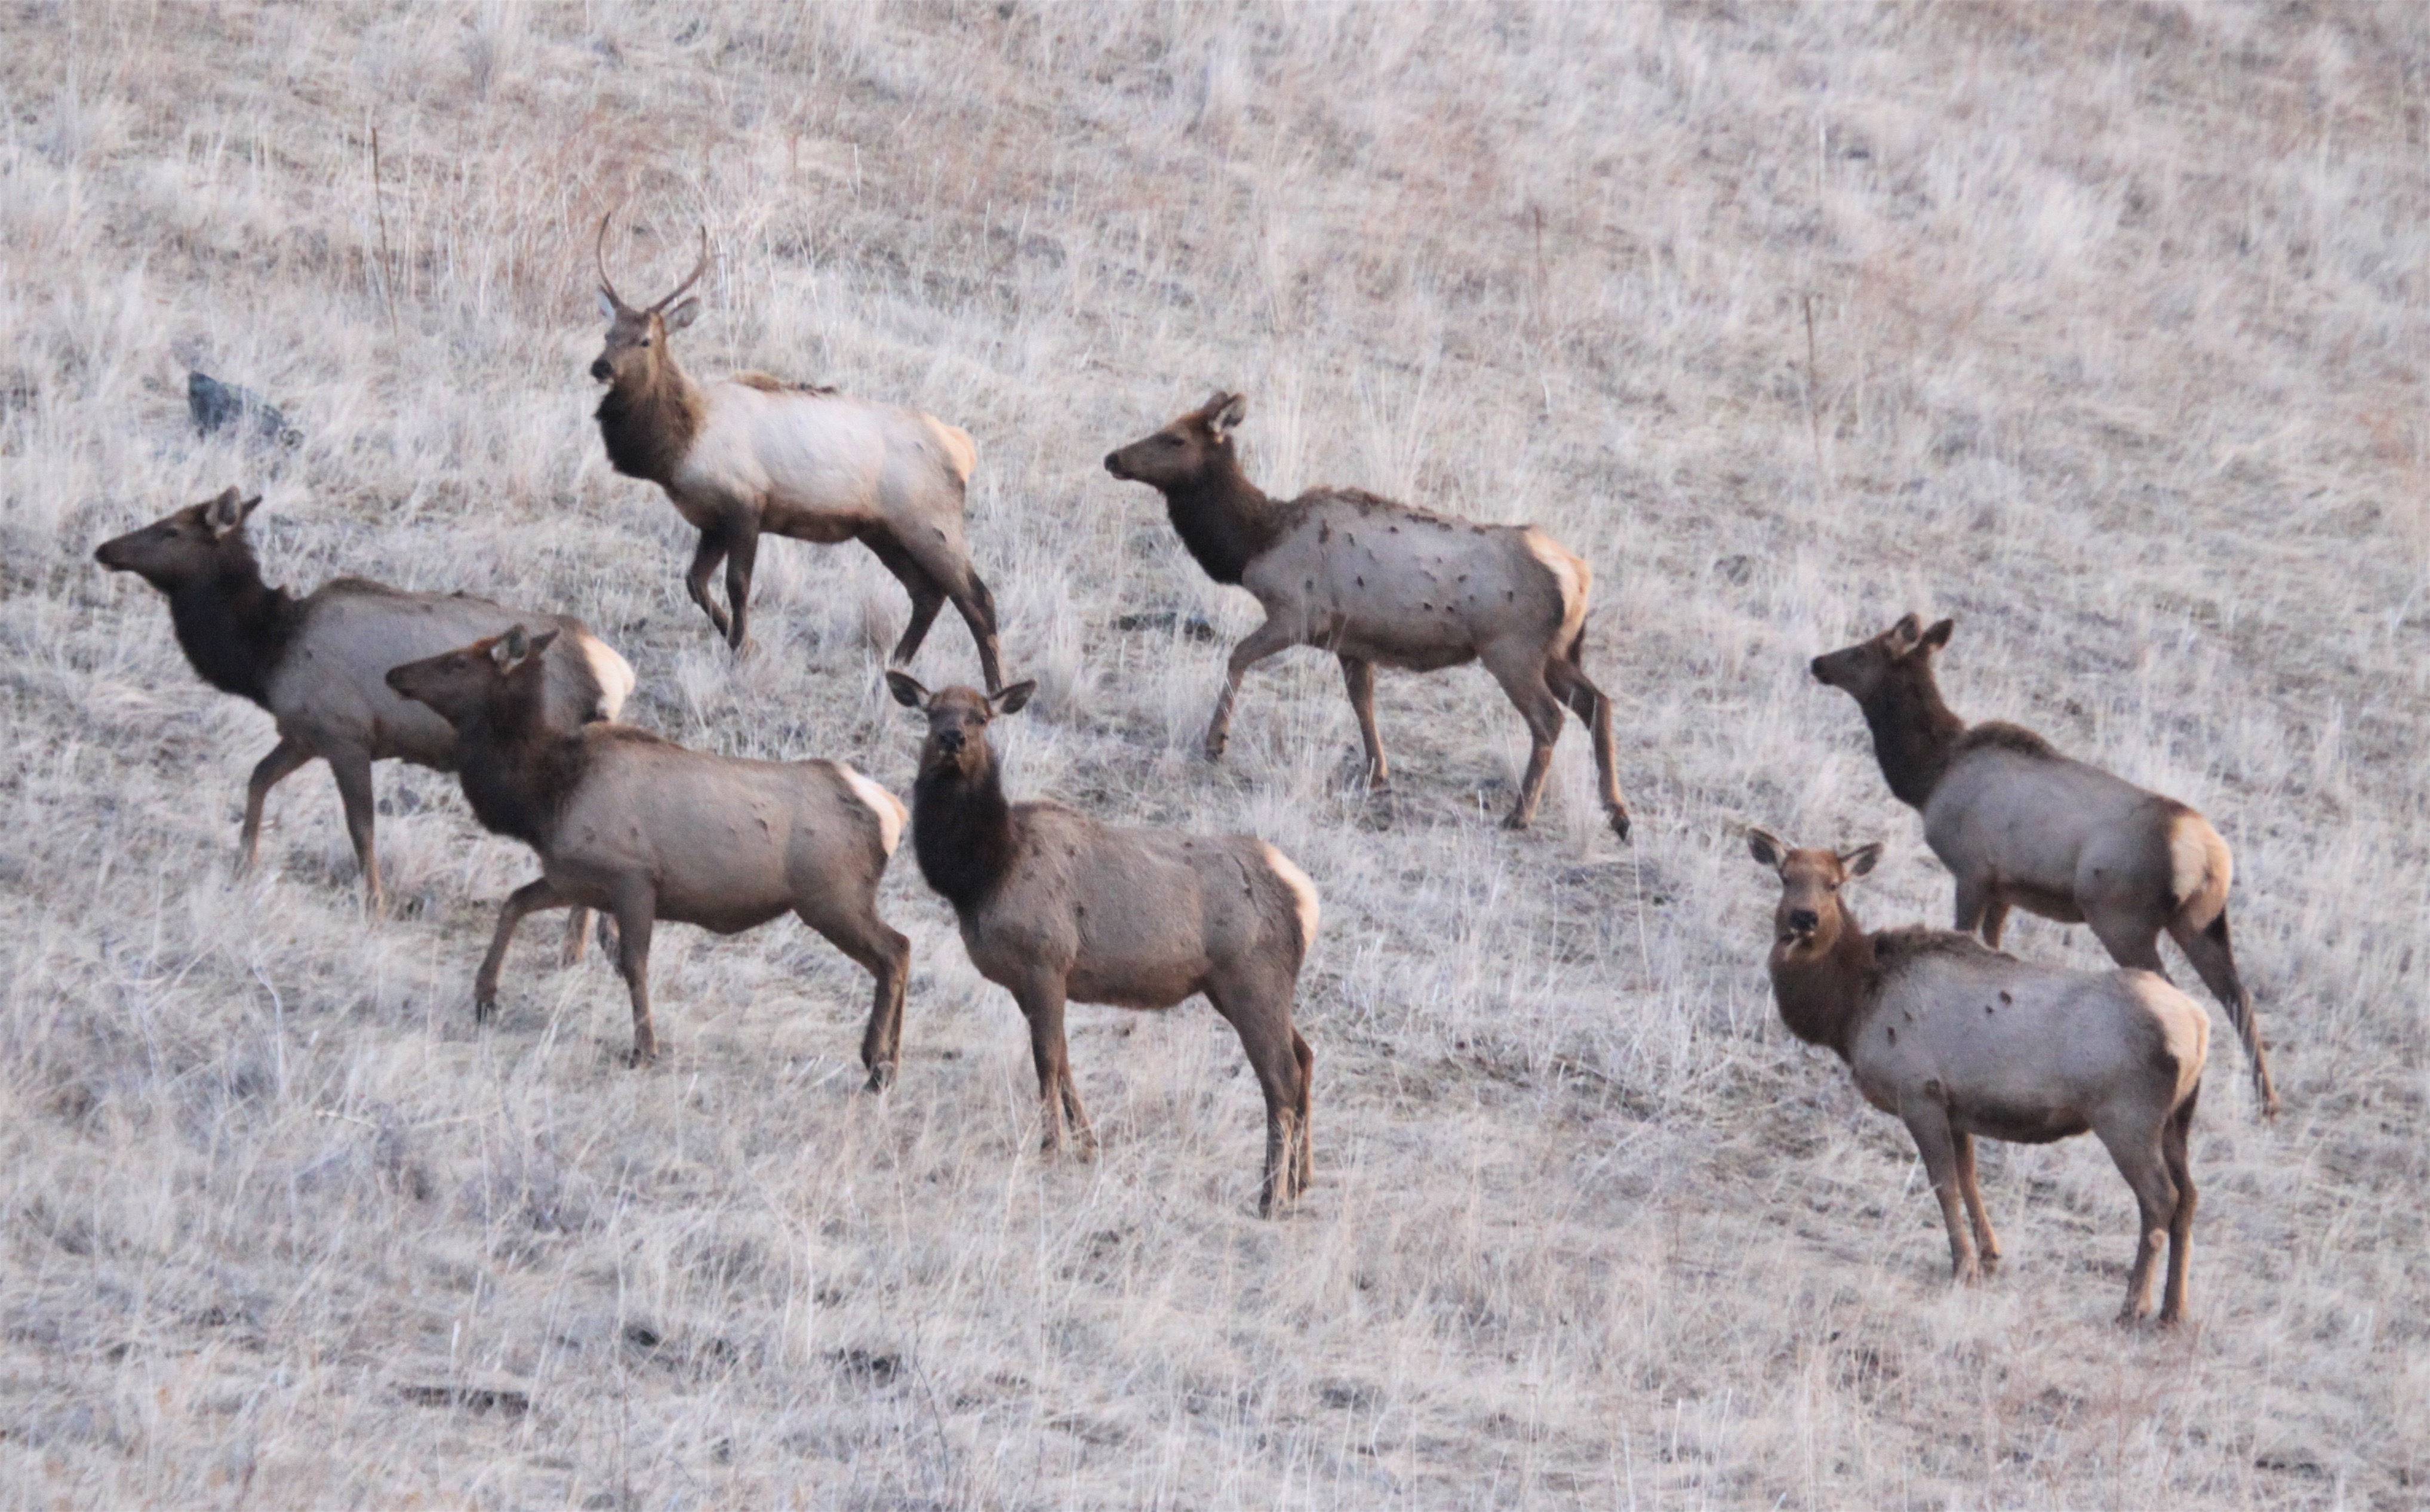
Elk hunting fell on hard times from 2008 through 2013 when annual harvests ranged between 15,155 and 17,470 elk, which were the lowest numbers since the mid 1980s . But elk hunting came roaring back in 2014 when the harvest topped 20,000 for the first time in seven years, and 2015 easily topped that with 24,543 elk taken.
Idaho’s elk harvest could top 25,000 this year, which has only happened three times in the last 40 years.
Elk tag sales have shown steep growth in the last four years, jumping from 71,634 in 2012 to 86,175 in 2015, and resident and nonresident tag sales are strong this year. The reason for all this is simple: There are more elk.
“Elk are not doing as well as we would like everywhere, but in most of the state, numbers are stable or have been increasing over the last few years,” Rachael said.
Hunters are seeing more elk, and there also are more complaints from farmer and ranchers who are dealing with large herds of elk on their agriculture lands and asking for relief. This is an important detail for hunters because Fish and Game issues controlled hunt tags to deal with that situation.
“It’s no surprise that harvest went up last year,” Rachael said. “We issued more elk tags in areas where landowners have been experiencing conflicts with their crops and rangeland to to provide relief from those depredations.”
Most of those are antlerless (cow) tags, which have a much higher success rate than general season tags for bulls, so they can quickly drive up the overall elk harvest.
But that doesn’t mean only hunters with controlled hunt tags are getting elk. The success rate for general-season hunters increased in 2015, and a respectable 31 percent of the elk taken during general hunts had six or more points, which likely means there are plenty of mature bulls out there, too.
Fish and Game is doing more intensive elk monitoring to track population trends. It recently expanded its winter monitoring to include both elk calves and cows. Crews radio collared and tracked 274 calves and 607 cows in different regions of the state. Calf survival was 74 percent, and 96 percent for cows through winter.
He noted elk are less susceptible to winter conditions than deer, so if deer survival is better than average, “elk are probably going to be doing even better.”
Top ten deer units (sorted by estimated percent success rate)
| Unit | Percent success | Hunters | Harvest | Antlered | Antler less | |
|---|---|---|---|---|---|---|
| 1 | 12 | 52.4 | 310 | 163 | 125 | 37 |
| 2 | 10A | 51.3 | 6,988 | 3,586 | 2,427 | 1,151 |
| 3 | 15 | 51.3 | 2,516 | 1,291 | 922 | 369 |
| 4 | 01 | 51.2 | 9,264 | 4,743 | 3,212 | 1,522 |
| 5 | 16 | 51.0 | 1,163 | 593 | 484 | 109 |
| 6 | 21A | 50.4 | 600 | 302 | 274 | 28 |
| 7 | 17 | 49.7 | 387 | 193 | 158 | 34 |
| 8 | 11A | 48.5 | 2,651 | 1,285 | 923 | 362 |
| 9 | 18 | 46.1 | 946 | 436 | 260 | 176 |
| 10 | 08 | 45.6 | 3,388 | 1,547 | 1,092 | 454 |
Top 10 deer units ranked by harvest
| Unit | Harvest | Hunters | Antlered deer | Antler less | Success rate % | |
|---|---|---|---|---|---|---|
| 1 | 01 | 4,743 | 9,264 | 3,212 | 1,522 | 51.2 |
| 2 | 39 | 3,603 | 13,201 | 2,653 | 941 | 27.3 |
| 3 | 10A | 3,586 | 6,988 | 2,427 | 1,151 | 51.3 |
| 4 | 02 | 2,102 | 5,132 | 1,524 | 578 | 41.0 |
| 5 | 08A | 2,044 | 5,345 | 1,355 | 689 | 38.2 |
| 6 | 76 | 1,847 | 4,450 | 1,643 | 204 | 41.5 |
| 7 | 03 | 1,767 | 5,551 | 1,103 | 663 | 31.8 |
| 8 | 43 | 1,766 | 4,686 | 1,495 | 271 | 37.7 |
| 9 | 05 | 1,664 | 3,983 | 1,180 | 484 | 41.8 |
| 10 | 08 | 1,547 | 3,388 | 1,092 | 454 | 45.6 |
Top 10 elk units by success rate
| Unit | Success rate % | Hunters | Harvest | Antlered | Antler less | |
|---|---|---|---|---|---|---|
| 1 | 37 | 40.1 | 562 | 225 | 90 | 132 |
| 2 | 20A | 36.9 | 234 | 86 | 86 | 0 |
| 3 | 21A | 34.3 | 680 | 233 | 200 | 33 |
| 4 | 28 | 32.2 | 1,316 | 424 | 374 | 50 |
| 5 | 63 | 31.8 | 1,118 | 355 | 106 | 249 |
| 6 | 30 | 31.4 | 402 | 126 | 26 | 100 |
| 7 | 36 | 31.0 | 667 | 207 | 195 | 12 |
| 8 | 27 | 30.9 | 779 | 240 | 238 | 2 |
| 9 | 29 | 30.0 | 871 | 261 | 60 | 201 |
| 10 | 37A | 29.4 | 327 | 96 | 27 | 69 |
Top 10 elk units by harvest
| Unit | Harvest | Hunters | Antlered | Antler less | Success rate % | |
|---|---|---|---|---|---|---|
| 1 | 04 | 827 | 6,362 | 827 | 0 | 13.0 |
| 2 | 10A | 744 | 3,373 | 552 | 185 | 22.1 |
| 3 | 39 | 602 | 4,080 | 587 | 15 | 14.8 |
| 4 | 22 | 566 | 2,266 | 471 | 95 | 25.0 |
| 5 | 66 | 556 | 2,274 | 296 | 260 | 24.4 |
| 6 | 23 | 503 | 2,330 | 385 | 118 | 21.6 |
| 7 | 24 | 488 | 3,267 | 251 | 237 | 14.9 |
| 8 | 06 | 443 | 2,941 | 443 | 0 | 15.1 |
| 9 | 08A | 438 | 2,569 | 278 | 159 | 17.0 |
| 10 | 28 | 424 | 1,316 | 374 | 50 | 32.2 |
