Ever want to show a graph of the elevational gradient profile of a stream or other linear feature? Or maybe you just want to draw a straight line and view the topographic gradient as a graph. Good news! An Elevation Profile tool* in the form of an ArcMap (10.2+) desktop Add-in is now located here:
U:\IFWISDATA\Downloads\Elevation_Profile
(Note 1: This drive is available only to IFWIS users. Read on...)
In the absence of permission to access this folder, the toolbar may be downloaded to the location of your choice from the link below. Please coordinate and limit downloads to one instance per bureau or region to minimize demands on shared drives.
Documentation from the developers is downloaded with the zipped file. Unzip the file to location choice, if applicable. Saving it near commonly used files (for all users in your area) improves network performance.
Once the option is loaded (Customize >> Add-in Manager >> Options tab >> Add Folder [specify location]), it can be activated in your project by simply selecting it from the Toolbars customization list at the top in your project. Look for Elevation Profile in the drop-down list and select it.
Note 2: You may have to refresh or restart your ArcMap project for the option to become available.
Using it is simple:
1) Set preferred options by clicking on the Profile Settings icon. Select the output file name and units (in the example, M units ["X"] are in miles and Z units ["Y"] are in feet; the default is meters)
2) Select the line feature(s) [Hint: begin with just one line]
3) Click the Graph icon. It will take a short while to calculate.
The returned graph(s) will show Resolution and the number of lines calculated in the lower left corner. Right-click to customize properties.
OR
Using the Pencil icon, draw a line across a gradient to be graphed. This will add a new feature to your project.
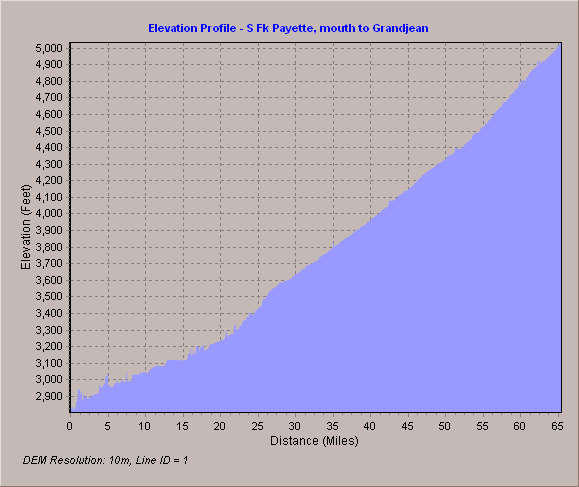
The tool appears to be pretty customizable. Plenty of options are located on the intuitively designed toolbar. Resize the graph by dragging the border. The example here is the elevation profile for one linear feature, South Fork Payette River from the mouth near Banks to Grandjean. Right-click on the returned graph to customize label details.
Note 3: This tool is a good candidate for replication to the regional geodatabases. Updates are currently scheduled to take place quarterly.
If you've discovered a favorite tool worth sharing, please contact Cyndi Coulter, Angie Schmidt, Pam Bond or Brent Thomas in IFWIS.
* Special thanks to Juan Laguna and Xuguang Wang for developing this handy tool and posting it to blogs.esri.com.