Henrys Lake Spawn 2020
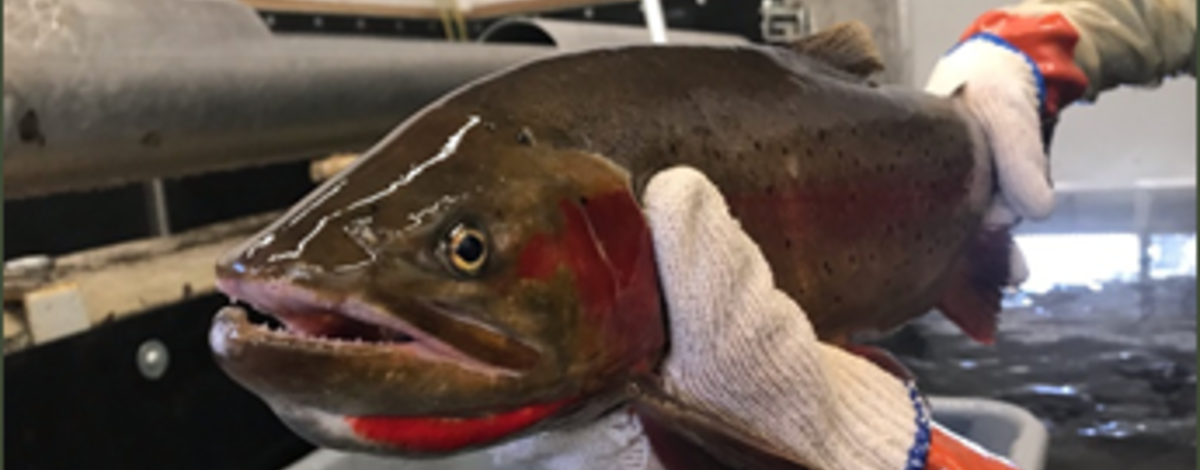
Each year, hundreds of Yellowstone Cutthroat Trout (YCT) are spawned at the Henrys Lake. We collect eggs from female YCT and milt from males YCT to create our YCT brood-stock. Sterile Hybrid Trout (HYB) are also created on site. Our Hybrid Trout is a cross between a Henrys Lake Yellowstone Cutthroat Trout (female) and Rainbow Trout (male) from our Hayspur Hatchery.
This year, a total of 11,878 trout entered our spawn shed during the month of February, while thousands more were staging in the lake waiting for their turn to climb the ladder. We opened the fish ladder on January 28th and conducted 7 spawn days throughout the month of February. A total of 1,758 female YCT were spawned to generate 770, 000 sterile HYB and 2.8 Million YCT green eggs. 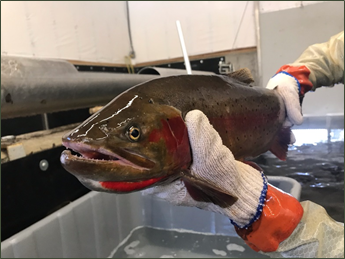
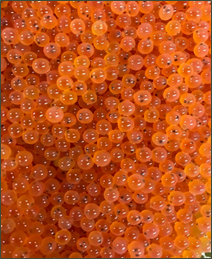
Following fertilization these eggs are incubated on site for approximately 28 days. Once the eggs have reached their “eyed” egg stage, which is the stage in development when a distinct eye spot is visible in the egg, they are sorted to remove any dead or unfertilized eggs. This year, approximately 64% of the Hybrid Trout and 91% of the Yellowstone Cutthroat Trout eggs survived to the eyed stage. These are great numbers, showing our fertilization process was a success! In the picture below you can see the distinct black eye spots in each egg.
Next, the HYB eggs were transported to our American Falls Fish Hatchery while all of the YCT eggs were transported to the Mackay Fish Hatchery. These eggs will finish incubation, hatch, and be raised to fingerling trout at these facilities before being stocked back into Henrys Lake this year. We plan to stock 250,000 HYB fingerlings and in June and 1 million YCT in September.
Want to see our work in action? Check out the link below to see a video of a typical Yellowstone Cutthroat Trout spawn day at Henrys Lake.
Big Lost River Angler Use and Harvest

Check stations and fish tagging (i.e., “Tag You’re It”) studies were conducted simultaneously throughout the upper Big Lost River basin in 2019 to collect data on angler effort, angler use, catch rates, and harvest. The reason for this work came from our concern of declining fish numbers at sites IDFG monitors regularly, and from concerns of anglers who thought too many fish in the Big Lost were being harvested.
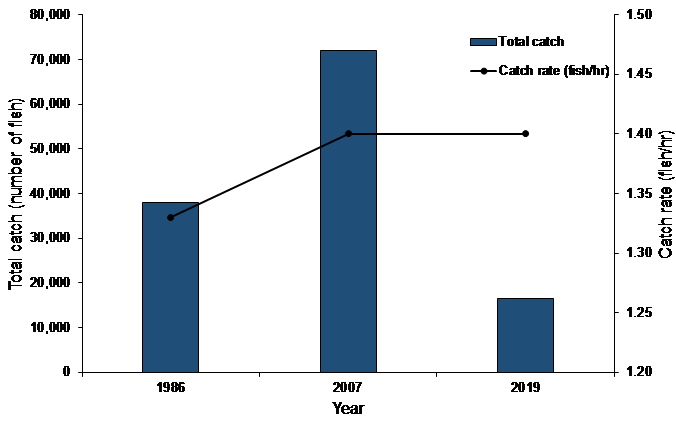
During surveys, bait anglers had the highest catch rates over other angler types (Figure 1). Bait anglers also reported the highest harvest rates at 38%, followed by lure anglers at 13%, and fly anglers at 1%. The overall estimate was 8% of the fish caught in the Big Lost River in 2019 were harvested. On average, anglers caught 1.4 fish/hr. This was similar to catch rates reported in earlier studies, although total catch was lower than previous studies because the total number of hours fished in 2019 was lower than previous survey years (Figure 2).
IDFG stocks hatchery fish in the Big Lost River. We marked several of the fish we stocked in 2020 with tags. Overall, 28% of the fish with tags that were stocked were caught by anglers. Some of these hatchery fish that were stocked (10%) were harvested (Table 1).
We have observed declining numbers of trout in the Big Lost River since 2007, and anglers have been voicing their concerns in recent years. The creel and “Tag You’re It” studies were important in providing current data on where anglers are fishing, how many fish are being harvested, and how the hatchery fish are being used in the upper Big Lost River. These data provide IDFG with information to guide decisions on how to improve fishing. Based on these studies, it appears harvest of trout is low and is likely not the reason causing trout numbers to decline. We’ve also learned where anglers are spending their time and where hatchery fish are making a difference for anglers during their fishing excursions.
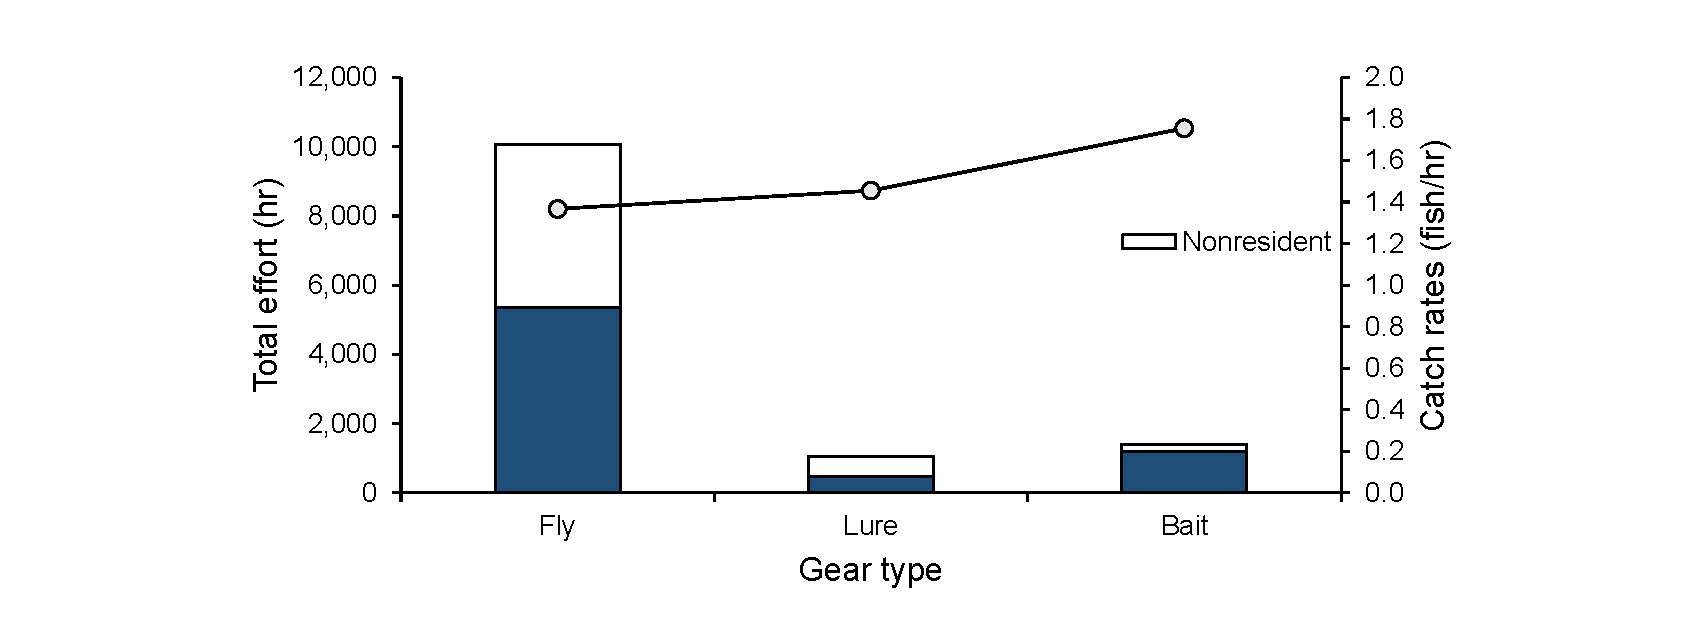
Figure 1. Total effort (hours; i.e., bars) and catch rates (number of fish per hour; i.e., line with points) by gear types. Bars are divided into nonresident (i.e., white portion) and resident (i.e., blue portion) effort to equal the total amount of estimated effort by fishing gear type.