Yes, it is true! You can make a PDF map spatially aware (aka georeferenced). Geospatial PDF’s allow users to obtain latitude and longitude coordinates, turn data layers on and off, view a selected features attributes, and to query and highlight data. This tutorial will explain how you create a spatially aware PDF map from ESRI ArcMap and view it in Adobe Reader. Just follow these easy steps! (NOTE: Interact with spatially referenced maps to view your location, record GPS tracks, add placemarks, and find places on your mobile device by downloading the Avenza Maps App avenza.com/avenza-maps).
1) Obtain the latest version of Adobe Reader (for free) at: http://get.adobe.com/reader/. NOTE: This tutorial uses Adobe Reader 10 so if you are using a later or newer version, some of the menus, etc. may be different.
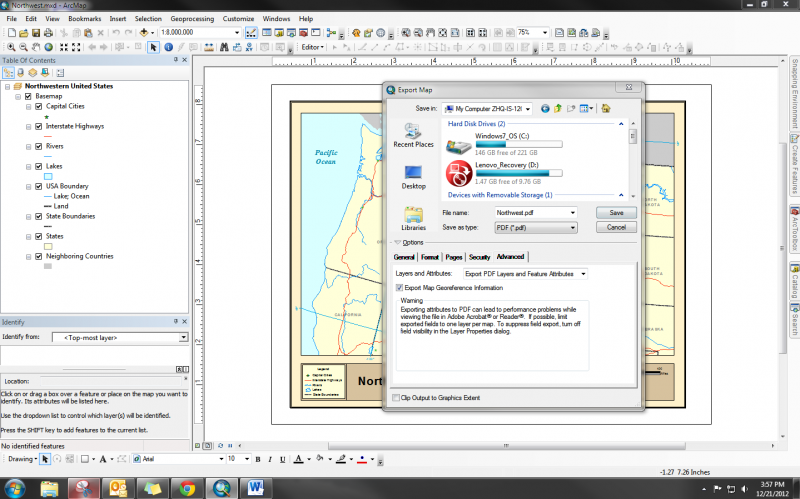
2) Once you have created your map in ArcMap, select Export Map… from the File menu. Choose PDF from the ‘Save as type:” dialog box. If it is not already expanded, expand the Options menu at the bottom of the Export Map dialog box. Select the Advanced tab. In the Layers and Attributes drop-down menu select ‘Export PDF Layers and Feature Attributes’. Also check the box in front of ‘Export Map Georeference Information’.
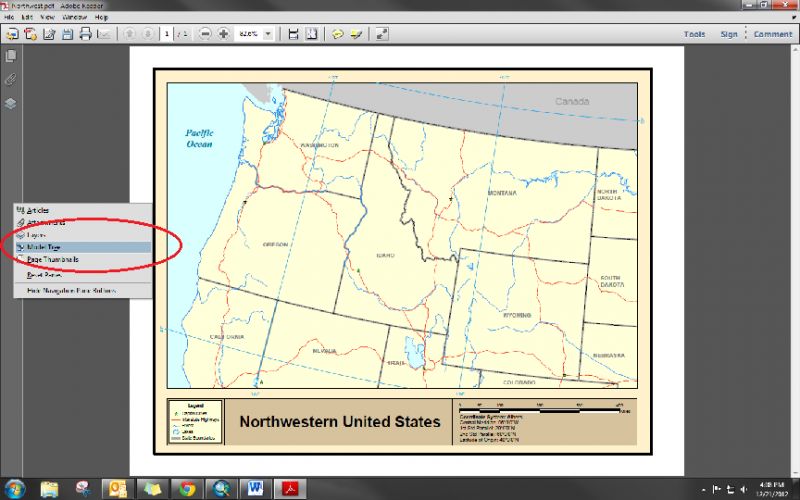
3) Open your exported map in Adobe Reader. Add the Model Tree to the Navigation Pane running down the left side of the Reader by right-clicking the panel.
4) Start exploring!
TOGGLE LAYERS ON & OFF
Click on the Layers icon in the Navigation Panel.

You can turn layers/labels on or off by clicking the Eye icon to the left of a group of or individual layers.

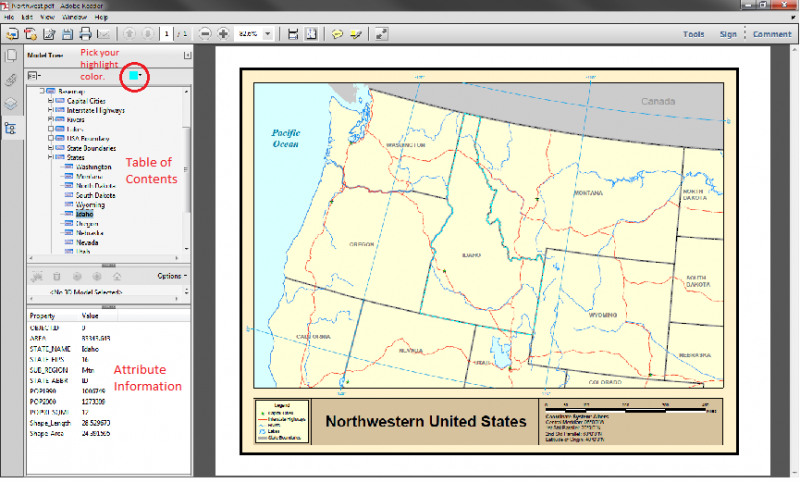
VIEW ATTRIBUTE DATA
Click on the Model Tree icon in the Navigation Panel.

Select a feature from the list to see its attributes (NOTE: These are the same attributes that appear in the attribute tables in ArcMap. If there is a field that is turned off in your ArcMap attribute table, it will also not appear in the PDF). The feature will also be highlighted in the map.
You can also select a feature with your mouse on the map to view its attributes in the Model tree. To do so, you must have the Object Data tool on. To turn this tool on: from the Edit menu, select Analysis, and then Object Data Tool.

Finally, using the Find tool is also a simple way to query for data. Simply type the name of the feature into the Find tool or Advanced Search search box. If there is more than one feature that meets the criteria, it will be listed on the screen. To see the attributes of a specific feature, select it from the search results list.

FIND LATITUDE AND LONGITUDE COORDINATES
To turn this tool on: from the Edit menu, select Analysis, and then Geospatial Location Tool. The location of the cursor while be shown in a text box at the bottom of the screen.
HELPFUL FACTS AND TIPS FROM THE ArcGIS RESOURCES WEBPAGE
http://resources.arcgis.com/en/help/main/10.1/index.html#/Exporting_to_PDF/00sm00000007000000/
· Each data frame will have its own folder in the tree view of the PDF that contains all the layers and the data frame graphics (neatline, background) associated with it.
· Text, picture, or north arrow elements added to a layout become part of a layer called Other. It contains all the graphics and marginalia that are not part of a data frame.
· Each group layer will be represented as a folder in the tree view, and the contents of the group layer will be presented within the group layer.
· Layers that cause rasterization, such as transparent layers, or layers that use a picture fill symbology consolidate all the layers below them into a single layer with the name Image.
· If a layer contains picture marker or picture fill symbology, use the option Vectorize picture markers/fills, found on the Format tab of the Options panel. This prevents rasterization of layers below picture markers and fills.
· Raster layers, such as orthophotos, consolidate all layers below them into a single Image layer. Place raster layers lower in the ArcMap table of contents to avoid this problem.
· Graphic or text elements added to the data frame's default graphics layer from data view become a layer called
· Backgrounds or drop shadows added to the data frame may become separate graphic elements and may be rendered multiple times as graphics. For example, if a data frame has a colored background, and the layout has a different colored background, the data frame's background may be rendered once to the data frame's Graphics or ArcGIS Layer and again to the layout's Graphics layer or ArcGIS Layer.
· Dynamic labels (not using annotation) in each data frame are rendered separately as part of a layer called Labels.
· Geodatabase annotation is displayed as a separate layer in the PDF. Map annotation is consolidated into the layer for the annotation group in which it belongs.
· When labels are converted to annotation, they are automatically placed in their own named annotation group and render separately from the
· Data frames and other layout elements are rendered in draw order when exported to PDF. Therefore, the topmost layout element in the map is the first element in the resultant PDF table of contents. Use the Bring Forward and Send Backward commands from the Draw toolbar to change the draw order of layout elements.
ENJOY!!!