idfg-badge

Idaho Fish and Game

Spring Chinook Salmon Fishing Update 5/2/2023: Rapid River Run, Hells Canyon, and Clearwater River Fisheries

idfg-jdupont

by Joe DuPont

Hi everybody.

It is time for my weekly spring Chinook Salmon update (May 2, 2023). So, let’s get right to it and discuss what we have learned since my last update.

Run Update

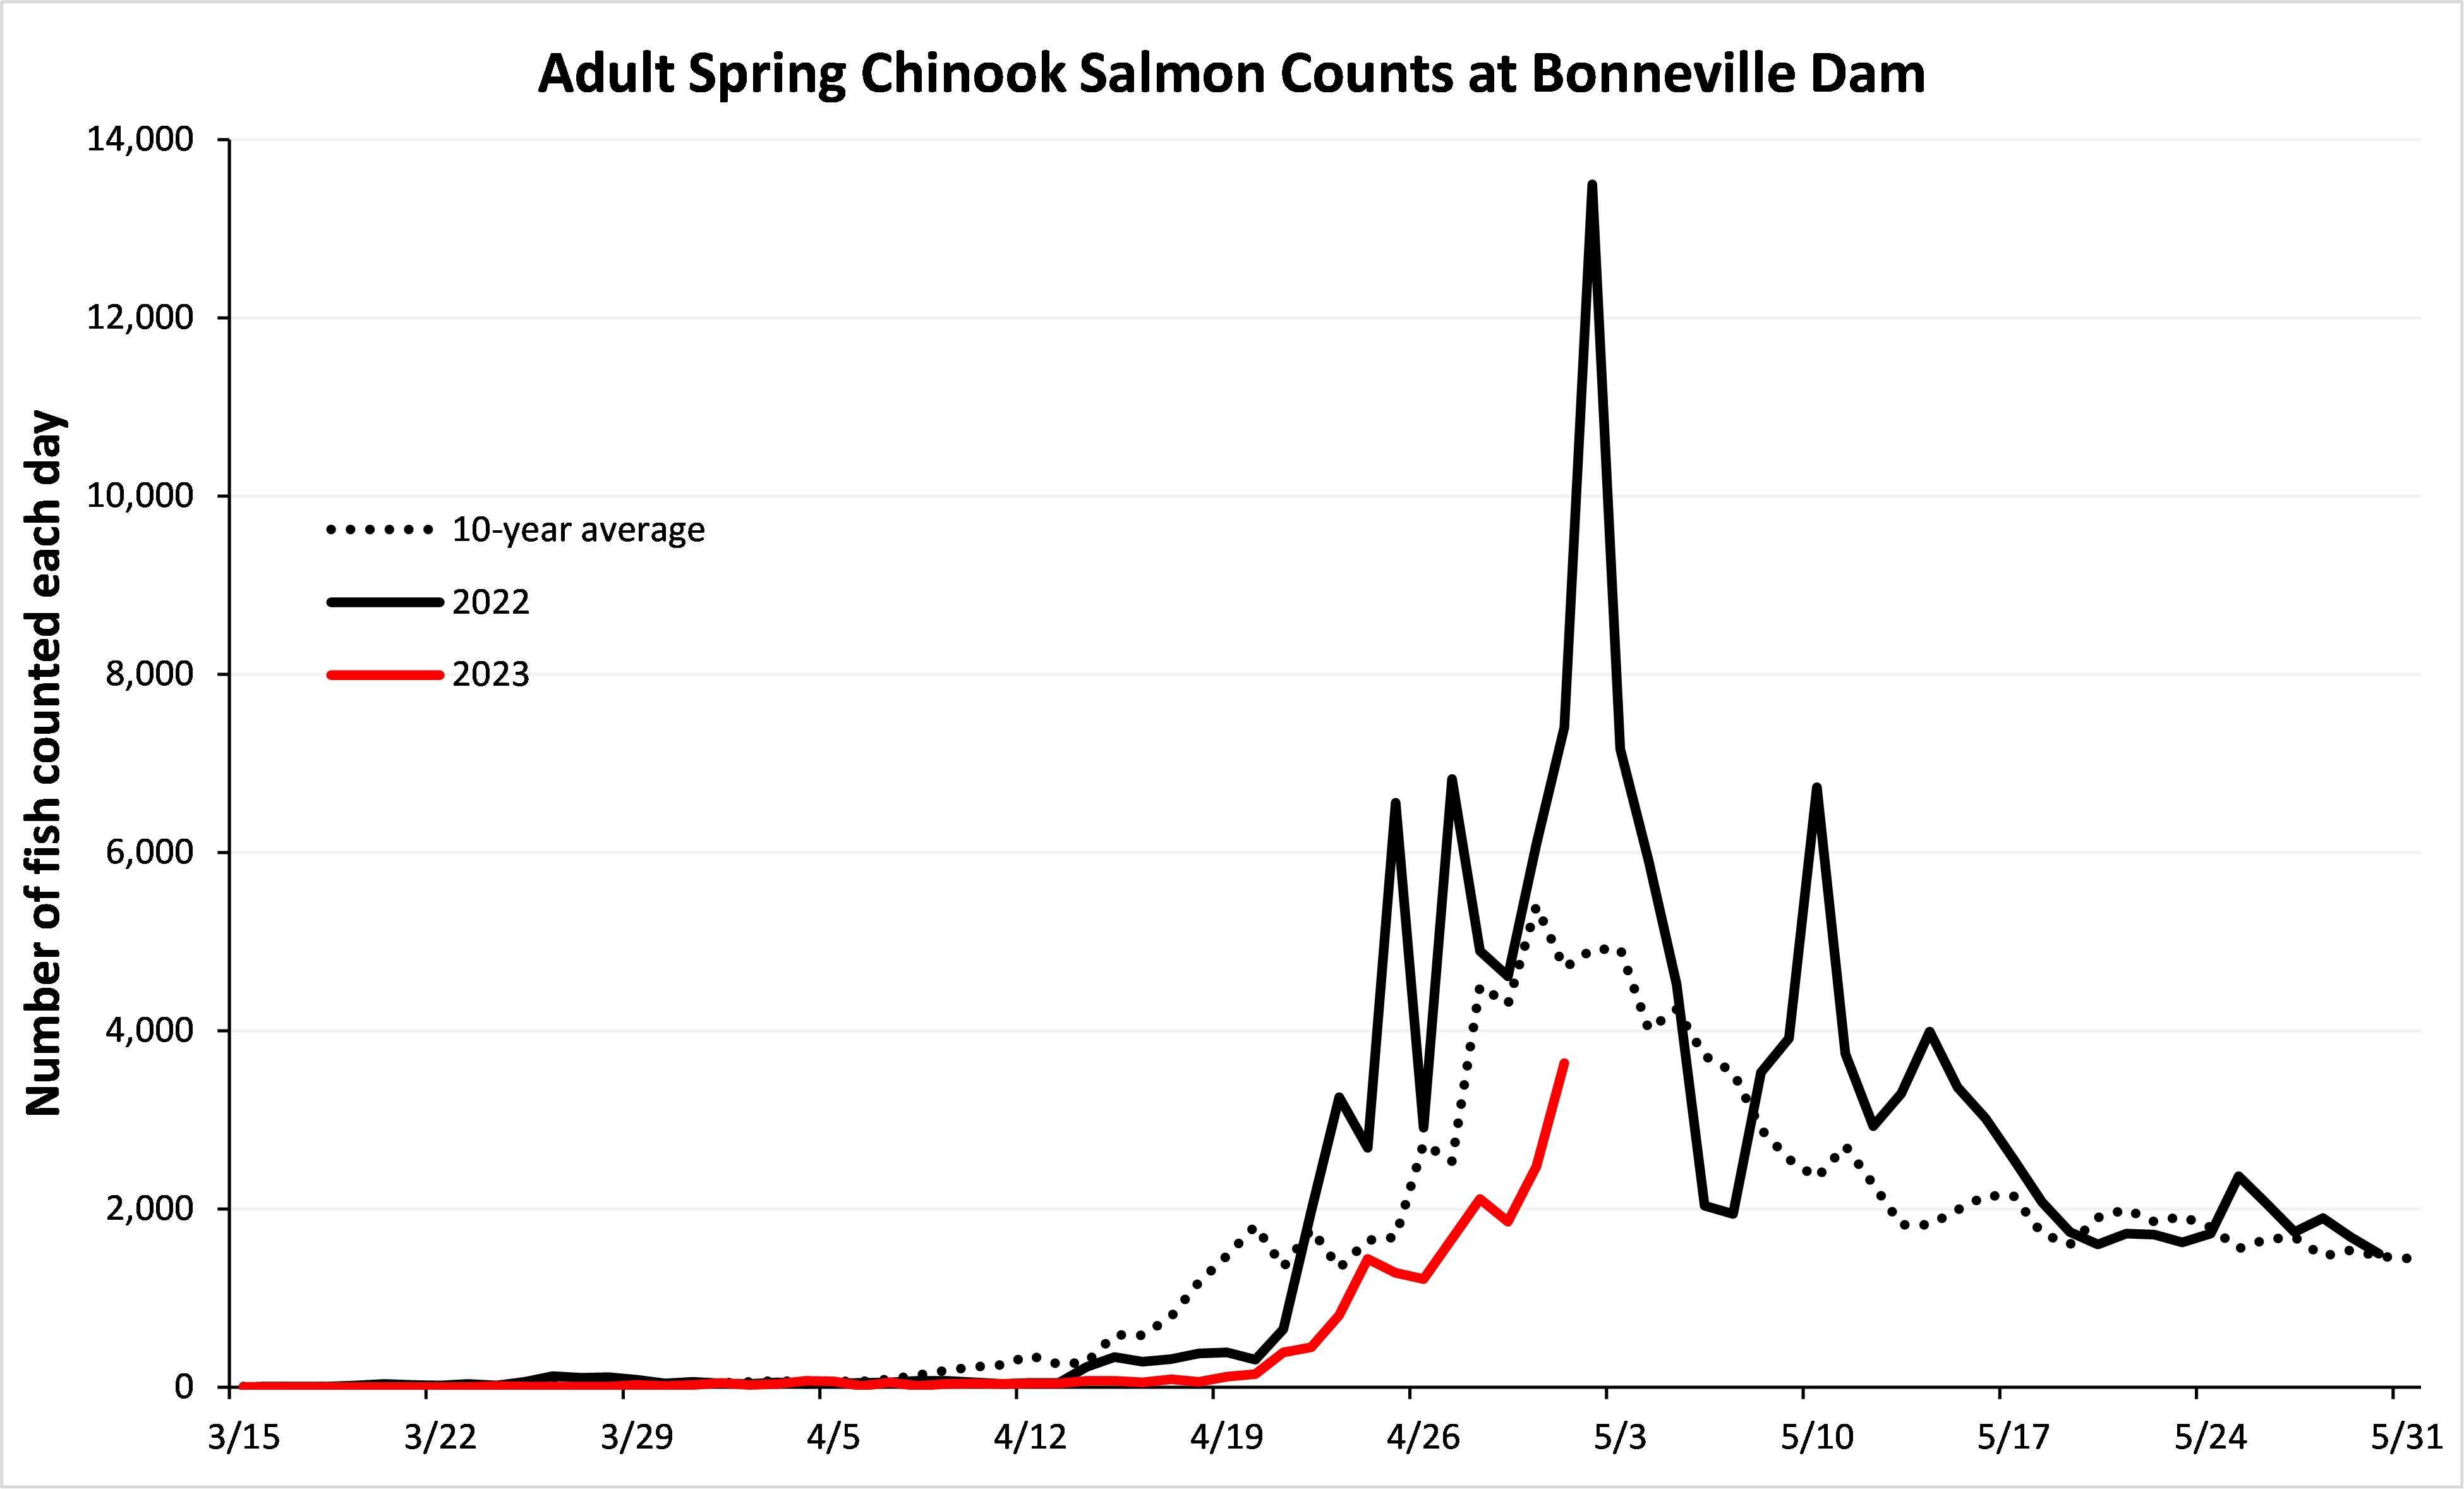
Since my last update, Chinook Salmon counts at Bonneville Dam have picked up. I have updated the figure below so it now shows daily dam counts of adult spring Chinook Salmon up through May 2 (red line) in comparison to last year’s return (solid black line) and the 10-year average (dotted black line). As you can see, the fish this year are arriving later than last year and in comparison to the 10-year average. If you compare the Bonneville Dam adult Chinook Salmon counts since 1939 for this time of year (March 15 through May 1), this year ranks as the 16th lowest (out of 85 years). This tells us the run is either late, small, or both. The concern is, the later the return becomes, the more likely the run is going to be small. For example, returns during 2017, 2018, and 2019 all had late returns, and for all three years, fewer fish returned than we have forecasted for this year. One thing we can do to give us more information on whether the run is small or not is to look at catch rates in the test fishery in the lower Columbia. This data shows catch rates are lower this year than last year and more consistent with low run years. What we need to see at this point is for the daily counts at Bonneville to surpass 4,000 fish and stay above that for at least a week, otherwise the run will likely come in under the forecast.

Chinook run timing over Bonneville 5-2-23

The obvious next question is how many of the fish passing over Bonneville Dam are destined for our fisheries in Idaho. To get at that question, we need to look at detections of PIT tagged fish at Bonneville Dam. The table below summarizes the PIT tag data we have collected to date (through 5/1/23). Because this is the first time I am presenting this table this year, I will go over it in more detail to make sure we all are on the same page. The information in the first column “Release Group” represents where the PIT tagged fish were released as smolts and where most will return to as adults. The second column indicates how many fish from each of these release groups we estimate have passed over Bonneville Dam to date. Because we PIT tag a known proportion of fish at the hatchery, we can expand each PIT tag detection using this proportion to estimate the actual return. The third column shows how many fish we project will ultimately pass over Bonneville Dam. This data is the tricky part because we don’t know how many fish are yet to come. To project how many fish are yet to come, we look at run timing curves (similar to what is shown in the figure above). In this case, I assumed the run timing is about a week late and projected how many fish will ultimately make it to Bonneville Dam. If the run is earlier than I projected, fewer fish will make it to Bonneville than estimated, and if the run is later, more will make it than estimated. Finally, the last column shows what the harvest share will be for the three fisheries that are currently open if the run projections are correct. The harvest share is calculated by estimating how many of the fish that pass over Bonneville Dam will make it to Idaho (typically around 70% make it to Idaho). We then subtract out how many of these fish are needed for broodstock, and then we divide these remaining fish in half (half are designated to the Tribes and half are designated to sport fisheries) to come up with our harvest share. 

Estimated spring Chinook harvest shares 5-2-23

OK, now that you know what is presented in the table above, let’s talk about what this data means. Remember, we have three spring Chinook Salmon fisheries that are open: Clearwater River return, Rapid River return, and Hells Canyon. Each of the bold lines in the table above provides the totals for each fishery and is what we use when managing the fisheries. The numbers I tend to focus on are the “Harvest Share” data. This table shows that the Clearwater River return harvest share is projected to be 1,705 adult fish, 2,240 for the Rapid River return, and 362 for Hells Canyon. These numbers are important because when we reach our adult harvest share, we must close down the fishery. At this point, I wouldn’t get too excited or depressed about the harvest shares presented above as we are early in the run and things can change quickly. If you were wondering, the harvest shares shown in the table above are below what we forecasted before the season started. 

I do need to make you aware that each year we collect genetic data from spring Chinook Salmon trapped at Lower Granite Dam to help us better understand how well the PIT-tagged fish are representing the actual return size. On average, PIT-tagged fish represent about 70% of the actual return. For example, if the real return was 1,000 fish, PIT-tagged fish on average would indicate the return was 700 fish. This underrepresentation is actually good as it helps ensure we make our broodstock needs because not all unharvested fish will make it to the hatchery trap due to straying and natural mortality. However, what we have learned from analyzing the genetic data is that occasionally PIT-tagged fish represent a much lower percent of the return - we have seen it as low as 45% in the past. On years when the PIT-tagged fish represent much lower than 70% of the return, we can increase harvest shares and still be confident we will make our broodstock needs. Typically, we will have enough genetic data collected by late May or early June to run the analysis, and the results should be ready about a week later. You may recall that we have increased the harvest share for the Rapid River return fishery in the past using this genetic data. I’ll remind you of this as we get closer to analyzing this data, so it doesn’t catch you off guard.

Collecting fin clip at Lower Granite Dam

Fisheries

We have not observed any harvest in Idaho to date, and nobody has called me to let me know that they caught a Chinook. This is not surprising seeing that only 45 Chinook Salmon have been counted at Lower Granite Dam to date (as of 5/1/23). Once fish start being harvested, I will break this section out into the three different fisheries and provide tables that show how many and where fish are being harvested.

I do want to mention that with the lower flows that occurred in the Columbia River in the past few weeks, it was taking our fish about two weeks to migrate from Bonneville Dam to Idaho. With flows steadily on the rise due to the warmer weather, it will take longer for the fish to make this migration. For those who like to fish the lower Salmon, it takes about 7-10 days for a Chinook Salmon to migrate from Lower Granite Dam to the beginning of the fishery (Rice Creek Bridge) during average flows. However, if flows start exceeding 60,000 cfs in the lower Salmon River, significant delays can occur as the fish try to navigate the Slide Rapid. Right now, flows in the lower Salmon are at 40,000 cfs and climbing.


I hope you all enjoyed this warm weekend and had a chance to get out. The fish will be here soon!