Hi everybody.
It is time for my weekly spring Chinook Salmon update (April 27, 2022). From here on out I’m going to break my updates into two parts. The first part will discuss what the run is looking like including what we estimate the harvest share will be for each of the fisheries. The second part will discuss what we are seeing in each of our fisheries including where and how much harvest has occurred, how much harvest share is remaining in our fisheries, and changes to the seasons and limits that are likely to or will be occurring. With that understanding, let’s get right to it.
Run Update
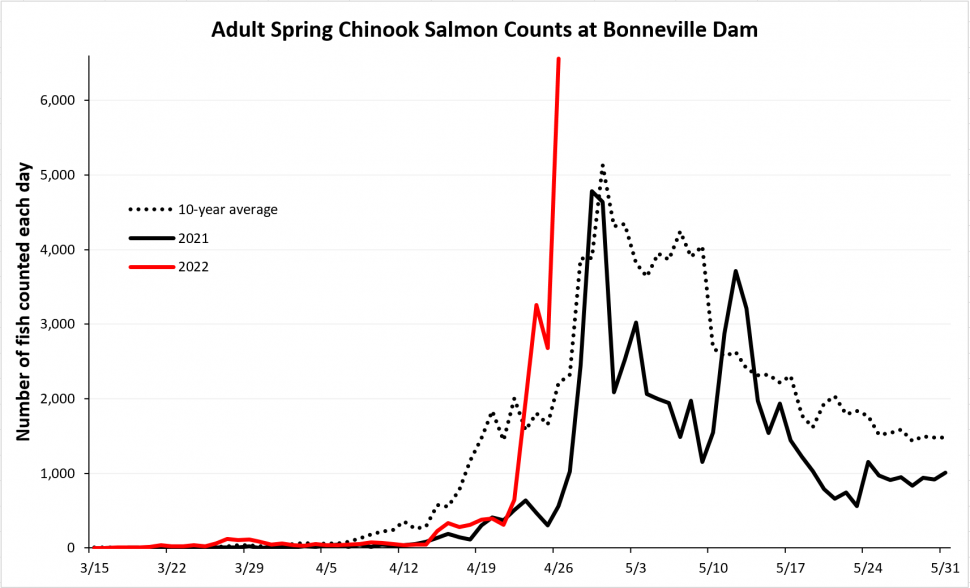
Since last week, we have seen some exciting changes in Chinook Salmon counts at Bonneville Dam. I have updated the graph I shared with you last week so it now shows this year’s dam counts up through April 26 (red line) in comparison to last year’s return (solid black line) and the 10-year average (dotted black line). As you can see, there has been a large increase in counts the past four days (from April 23 to 26) bringing the total counts for adult spring Chinook Salmon (March 15 to April 26) to 18,748 fish. This is the highest count at Bonneville Dam for this date since 2015 which is an improvement over what I reported last week. In case you were wondering, the highest daily adult count we have seen in the last 10 years was 17,409 adult fish in 2014. The highest daily adult count we have ever seen at Bonneville Dam during the spring Chinook return was 27,020 fish in 2001. So, there is still room for improvement If we can maintain counts above 3,000 adult fish for a two week period, that could result in some meaningful fisheries.
The obvious question is, how many of these fish are destined for our fisheries in Idaho. To get at that question, we need to look at detections of PIT tagged fish at Bonneville Dam. The table below summarizes the PIT tag data we have collected to date. Because this is the first time I am presenting this table this year, I will go over it in more detail to make sure we all are on the same page. The information in the first column “Release Group” represents where the PIT tagged fish were released as smolts and where most will return to as adults. The second column indicates how many fish from each of these release groups we estimate have passed over Bonneville Dam to date. Because we PIT tag a known proportion of fish at the hatchery, we can expand each PIT tag detection using this proportion to estimate the actual return. The third column shows how many fish we project will ultimately pass over Bonneville Dam. This data is the tricky part because we don’t know how many fish are yet to come. To project how many fish are yet to come, we look at run timing curves (similar to what is shown in the figure above). In this case, we used the average run timing to project how many fish will ultimately make it to Bonneville Dam. If the run is earlier than average, fewer fish will make it to Bonneville than we are projecting, and if the run is late, more will make it than we projected. Finally the last column shows what we are estimating our harvest share will be for the three fisheries that are currently open. The harvest share is calculated by estimating how many of the fish that pass over Bonneville Dam will make it to Idaho. We then subtract out how many of these fish are need for broodstock, and then we divide these remaining fish in half (half are designated to the Tribes and half are designated to sport fisheries) to come up with our harvest share.
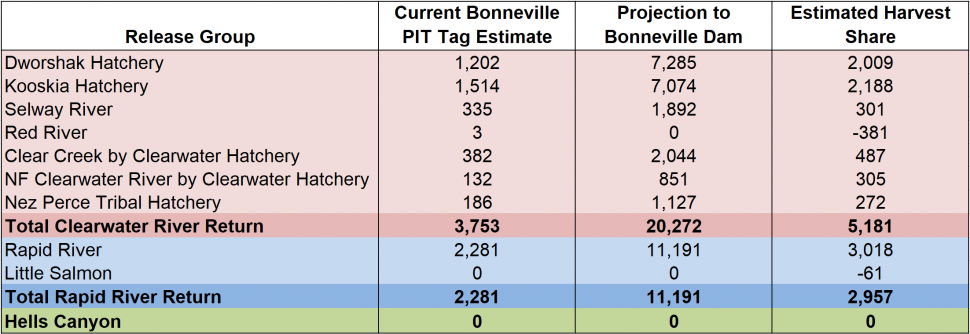
OK, now that we know what is presented in the table above, let’s talk about what this data means. Remember, we have three spring Chinook Salmon fisheries that are open: Clearwater River return, Rapid River return, and Hells Canyon. Each of the bold lines in the table above provides the totals for each fishery and is what we use when managing the fisheries. The numbers I tend to focus on are the “Harvest Share” data. This table shows that the Clearwater River return harvest share is projected to be 5,181 fish, 2,957 for the Rapid River return, and zero for Hells Canyon. These numbers are important because when we reach our adult harvest share we must close down the fishery. At this point, I wouldn’t get too excited or depressed about the harvest shares presented above as we are early in the run and things can change quickly. If you were wondering, the harvest share shown in the table above for the Clearwater River return is above what we forecasted and the Rapid River return is below. We didn’t release smolts below Hells Canyon Dam two years ago, so we aren’t expecting many adult fish to return there this year. This fishery will mostly be for jacks.
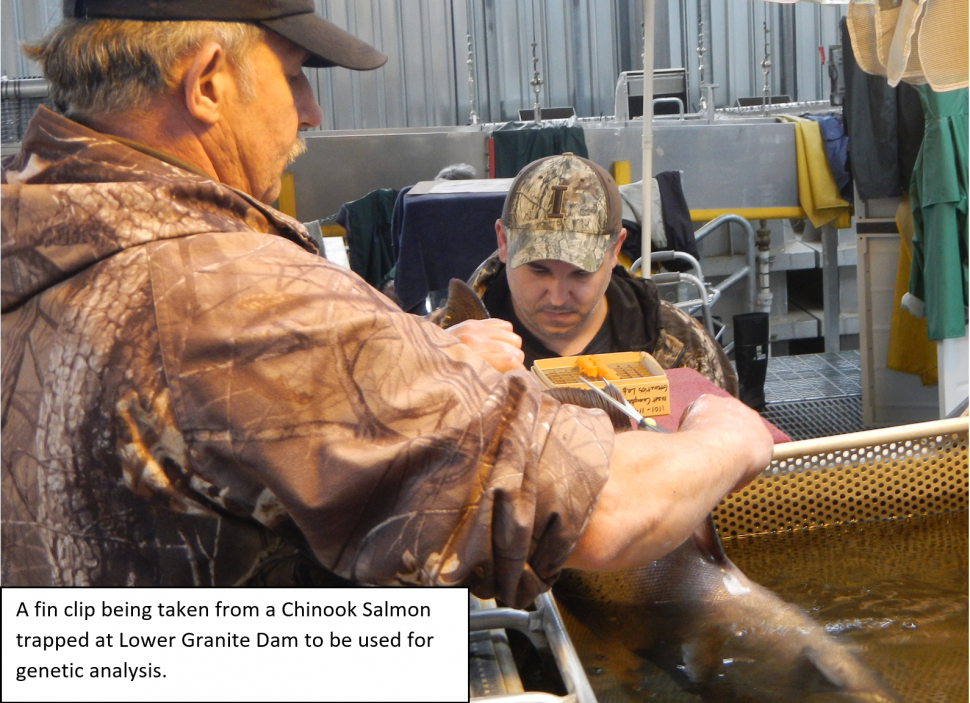
I do need to make you aware that each year we collect genetic data from spring Chinook Salmon trapped at Lower Granite Dam to help us better understand how well the PIT-tagged fish are representing the actual return size. On average, PIT-tagged fish represent about 70% of the actual return. For example, if the real return was 1,000 fish, PIT-tagged fish on average would indicate the return was 700 fish. This underrepresentation is actually good as it helps ensure we make our broodstock needs because not all unharvested fish will make it to the hatchery trap due to straying and natural mortality. However, what we have learned from analyzing the genetic data is that occasionally PIT-tagged fish represent a much lower percent of the return - we have seen it as low as 45% in the past. On years when the PIT-tagged fish represent much lower than 70% of the return, we can increase harvest shares and still be confident we will make our broodstock needs. Typically, we will have enough genetic data collected by late May to run the analysis, and the results should be ready by early June. You may recall that we actually increased the harvest share for the Rapid River return fishery last year using this genetic data, and there are some indicators that this may happen again this year. I’ll remind you of this as we get closer to analyzing this data so it doesn’t catch you off guard.
Fisheries
Over last weekend we did observe a few anglers out fishing on the lower Clearwater River, but not too surprising we did not document any harvest. Fewer than 100 fish had passed over Lower Granite Dam before the weekend, so if anybody did catch a fish, it would have been like winning the lottery. As we start documenting harvest in our creel surveys, I will provide individual updates for each fishery.
I do want to mention that with the low flows we are seeing in the Columbia and Snake rivers, it should take about two weeks for fish to get to Idaho after they pass over Bonneville Dam. That means the peak of fish that has been passing over Bonneville Dam should start arriving in the lower Clearwater on the week of May 7. You would need to add another 7-10 days for these fish to reach the lower Salmon River fishery. I do need to mention that right now the Corp of Engineers is having some problems with operating the spill gates at Lower Monumental Dam (second dam up from the mouth of the Snake River). This is creating some flow issues below the dam that is slowing down fish passage. We aren’t sure how long it will take to fix this issue, but this could increase the amount of time it takes for fish to reach Idaho.
I haven’t been this excited about a spring Chinook Salmon fishery for quite some time. I don’t know about you, but I’m going to start putting new line on my reels and tying up hooks. Talk to you all next week.