Idaho Hunt Planner We got game.
Hunt Area
Includes the following counties or portions of counties: Ada; Boise; Canyon; Cassia - except the Minidoka National Wildlife Refuge; Elmore - except the Camas Creek drainage; Gem; Gooding; Jerome; Lincoln; Minidoka; Owyhee; Payette; Power west of State Highway 37 and State Highway 39 except the Minidoka National Wildlife Refuge; Twin Falls; and Washington Counties.
More information about the Game Management Unit(s) in this area: 22 24 31 32 32A 33 33 34 35 35 35 38 38 39 39 40 41 42 43 44 45 46 47 52 52A 52A 53 53 53 54 55 56 57 68 68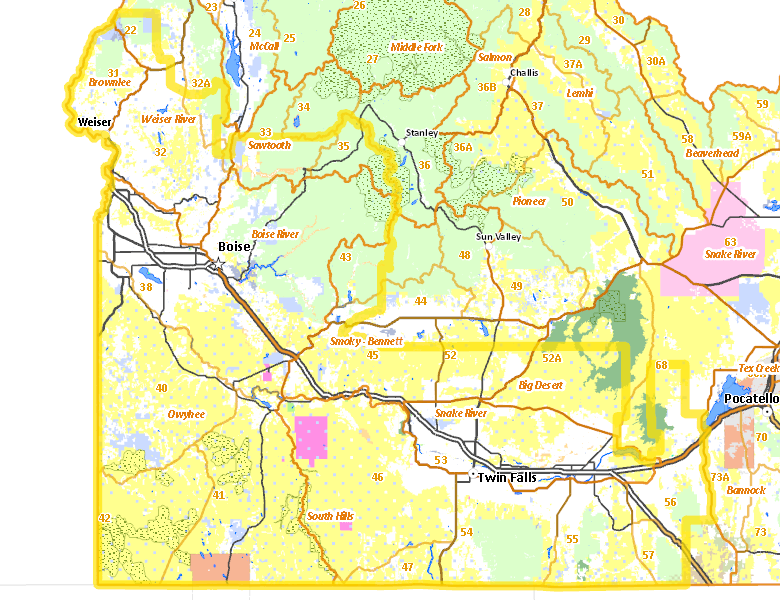
Surface Management
For government land, these data show the managing agency of the land, which may or not be the same as the owning agency.
 U.S. Bureau of Land Management (BLM) 44.8%
|
|
Private 32.15%
|
|
U.S. Forest Service (USFS) 14.23%
|
|
State of Idaho 5.16%
|
|
Indian Reservation / Bureau of Indian Affairs 0.9%
|
|
U.S. National Park Service (NPS) 0.83%
|
|
U.S. Military 0.78%
|
|
U.S. Bureau of Reclamation (BOR) 0.74%
|
|
Other 0.28%
|
|
U.S. Department of Interior (DOI) 0.04%
|
|
U.S. Department of Agriculture (USDA) 0.03%
|
|
U.S. National Wildlife Refuge (NWR) 0.01%
|
|
U.S. Corps of Engineers (COE) 0%
|
Make your own map of Hunt Area
Ownership data source: Inside Idaho
Access Yes! Properties
Access Yes! is Fish and Game program designed to improve hunting and fishing access to private land or through private land to public land by compensating willing landowners who provide access.
- Paddock Valley Reservoir
- Sturgill Creek
- Letha - Payette River Access
- Diamond A Livestock - Little Pilgrim Gulch
Forest Service Land
Check for road and area closures on National Forest websites
- Boise National Forest
- Caribou National Forest
- Payette National Forest
- Sawtooth National Forest
- Salmon-Challis National Forest
Federally-designated Wilderness Areas
No motorized vehicles are allowed in these areas.
- Owyhee River Wilderness 272,397 acres (1.69% of hunt area)
- Sawtooth Wilderness 149,723 acres (0.93% of hunt area)
- Bruneau-Jarbridge Rivers Wilderness 94,853 acres (0.59% of hunt area)
- Big Jacks Creek Wilderness 56,546 acres (0.35% of hunt area)
- Little Jacks Creek Wilderness 54,935 acres (0.34% of hunt area)
- North Fork Owyhee Wilderness 44,684 acres (0.28% of hunt area)
- Pole Creek Wilderness 13,405 acres (0.08% of hunt area)
Land Use/Land Cover
|
Rangeland
63.05
%
|
|
Forest
15.43
%
|
|
Irrigated-Gravity Flow
9.97
%
|
|
Irrigated-Sprinkler
5.76
%
|
|
Dryland Agriculture
1.87
%
|
|
Riparian
1.76
%
|
|
Urban
1.07
%
|
|
Rock
0.83
%
|
|
Water
0.25
%
|
Make your own map of Hunt Area
Land Use data source: IDWR
Towns in this Hunt Area
- Boise, Interstate 84 Idaho 55 Idaho 21
- Nampa, Interstate 84 Idaho 55
- Meridian, Interstate 84 US 20-26
- Twin Falls, Interstate 84 US 93 US 30
- Caldwell, Interstate 84 US 20-26 Idaho 55
- Eagle, Idaho 55 Idaho 44
- Mountain Home, Interstate 84 US 20 Idaho 51
- Garden City, Idaho 55 Interstate 84
- Burley, Interstate 84 Idaho 27 US 30
- Jerome, Idaho 79 Interstate 84
- Kuna, Idaho 69
- Payette, US 95 Idaho 52
- Emmett, Idaho 52
- Rupert, Interstate 84 Idaho 24
- Weiser, US 95
- American Falls, Interstate 86 Idaho 39
- Fruitland, US 30 US 95
- Buhl, US 30
- Gooding, US 26 Idaho 46
- Heyburn, Interstate 84 US 30
- Homedale, US 95
- Wendell, Interstate 84
- Garden Valley, Garden Valley Rd.
- Parma, US 95
- Filer, US 30
- Glenns Ferry, Interstate 84
- Wilder, US 95
- Shoshone, US 26 US 93 Idaho 24
- New Plymouth, Idaho 52 US 30
- Marsing, Idaho 55
- Horseshoe Bend, Idaho 55 Idaho 52
- Hagerman, US 30
- Oakley, Idaho 27
- Idaho City, Idaho 21
- Grand View, Idaho 78
- Cambridge, US 95
- Bliss, Interstate 84
- Albion, Idaho 77
- Hollister, US 93
- Lowman, Idaho 21
- Minidoka, Idaho 24
- Bruneau, Idaho 51
- Murphy, Idaho 78
- Rogerson, US 93
- Almo, Idaho 77
- Atlanta, Idaho 21
- Silver City, Silver City Rd.