Idaho Hunt Planner We got game.
Unit 68
- Region 6
- Upper Snake Region
- Big Desert Elk Zone
- Units 52A, 53, 68, 68A
Game Management Unit Boundary
Those portions of BINGHAM, BLAINE, BUTTE, CASSIA, MINIDOKA, and POWER COUNTIES within the following boundary: beginning at Arco, then southeast on U.S. 26 to Blackfoot, then southwest on State Highway 39 to American Falls, then southwest on Interstate 86 to the Cassia-Power County line east of Raft River, then north along the county line to the Snake River, then northwest along the northern boundary of the Minidoka National Wildlife Refuge to the Minidoka-Blaine County line, then north along the Minidoka-Blaine County line to the Union Pacific Railroad tracks, then west on the tracks to Minidoka, then north on the Minidoka- Arco Road to Arco, the point of beginning.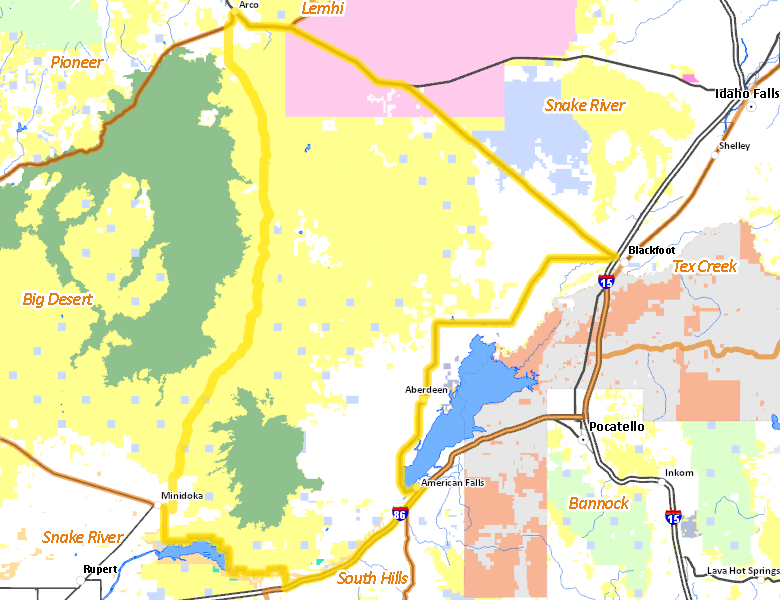
Public Access
Surface Management
For government land, these data show the managing agency of the land, which may or not be the same as the owning agency.
| U.S. Bureau of Land Management (BLM) |  54.56
%
54.56
%
|
| Private |
29.82
%
|
| U.S. National Park Service (NPS) |
6.72
%
|
| U.S. Department of Energy (DOE) |
6.16
%
|
| State of Idaho |
2.13
%
|
| U.S. Bureau of Reclamation (BOR) |
0.35
%
|
| Other |
0.21
%
|
| U.S. National Wildlife Refuge (NWR) |
0.04
%
|
Make your own map of Unit 68
Ownership data source: Inside Idaho
Access Yes! Properties
No properties are currently available in Unit 68.
View all Access Yes Participants.
National Forests
No National Forest lands fall within Unit 68.
Federally-designated Wilderness Areas
No motorized vehicles are allowed in these areas.
There are no wilderness areas in Unit 68.
Land Use/Cover
| Rangeland |
68.01
%
|
| Irrigated-Sprinkler |
23.13
%
|
| Rock |
6.86
%
|
| Irrigated-Gravity Flow |
1.51
%
|
| Dryland Agriculture |
0.41
%
|
| Water |
0.09
%
|
| Urban |
0.03
%
|
| Riparian |
0.03
%
|
Make your own map of Unit 68
Land Use data source: IDWR